Loading
Loading

As user experience designers in our team we also were responsible to improve overall usability and user experience in Power BI desktop product. This page contains some of the major improvements that I was a designer for them.
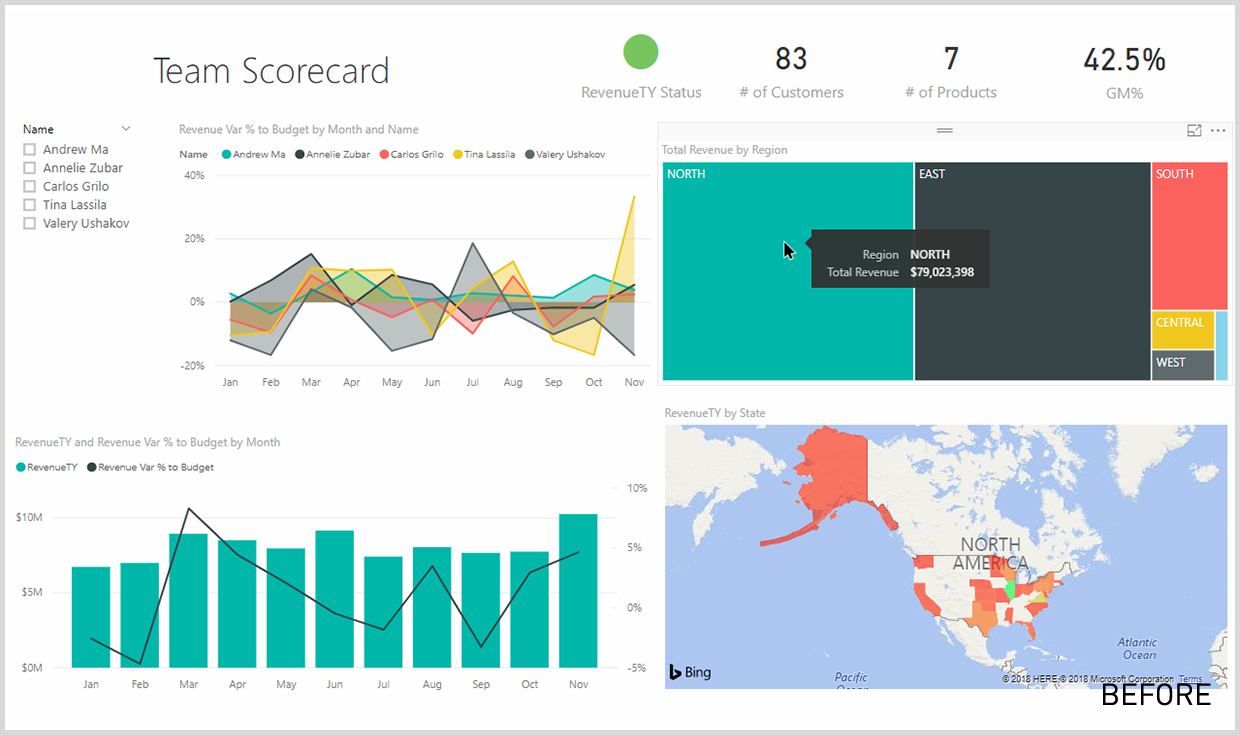
What is Power BI?Power BI already had an ability to customize tooltips for visuals in report pages, but it was very basic and we wanted to add another level of customization for users. We wanted to use what users had in their reports and use them as another layer of information on top of user’s visuals like a tooltip.
This way users can design any tooltip with any information they want and easily choose the layout of their tooltip because it is visual in report page and they already know how to create them.
You can see the difference between normal tooltip and report page tooltip in this image below, as you can see the report tooltips can be really rich and have much more useful information.
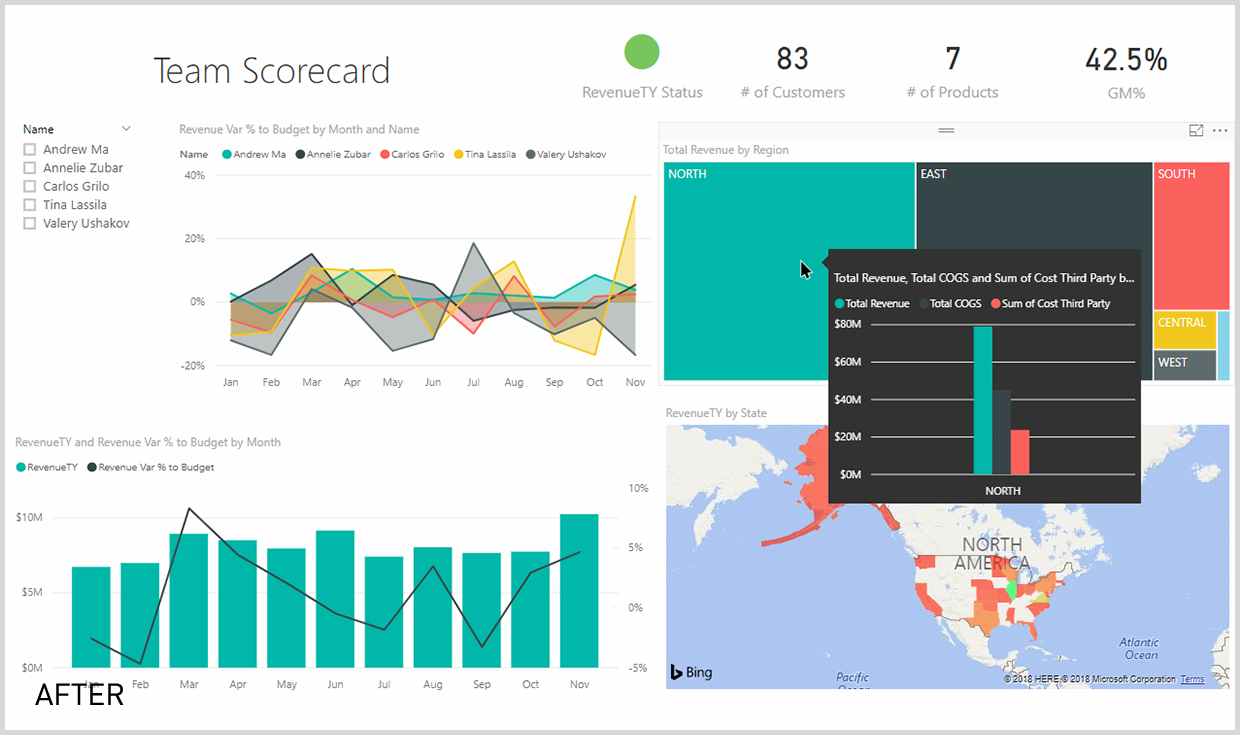
During this update I also worked on improving the tooltip animations, sometimes because of performance and other issues some tooltips might take some time to load and we wanted to have an animation for these cases.
Before releasing this feature Power BI didn’t have an ability to import a theme file and change the whole report color pallete, users had to manually change the colors of each visual from their properties.
With this feature users can easily create a .json file that contains all color values and import them directly from Power BI desktop.
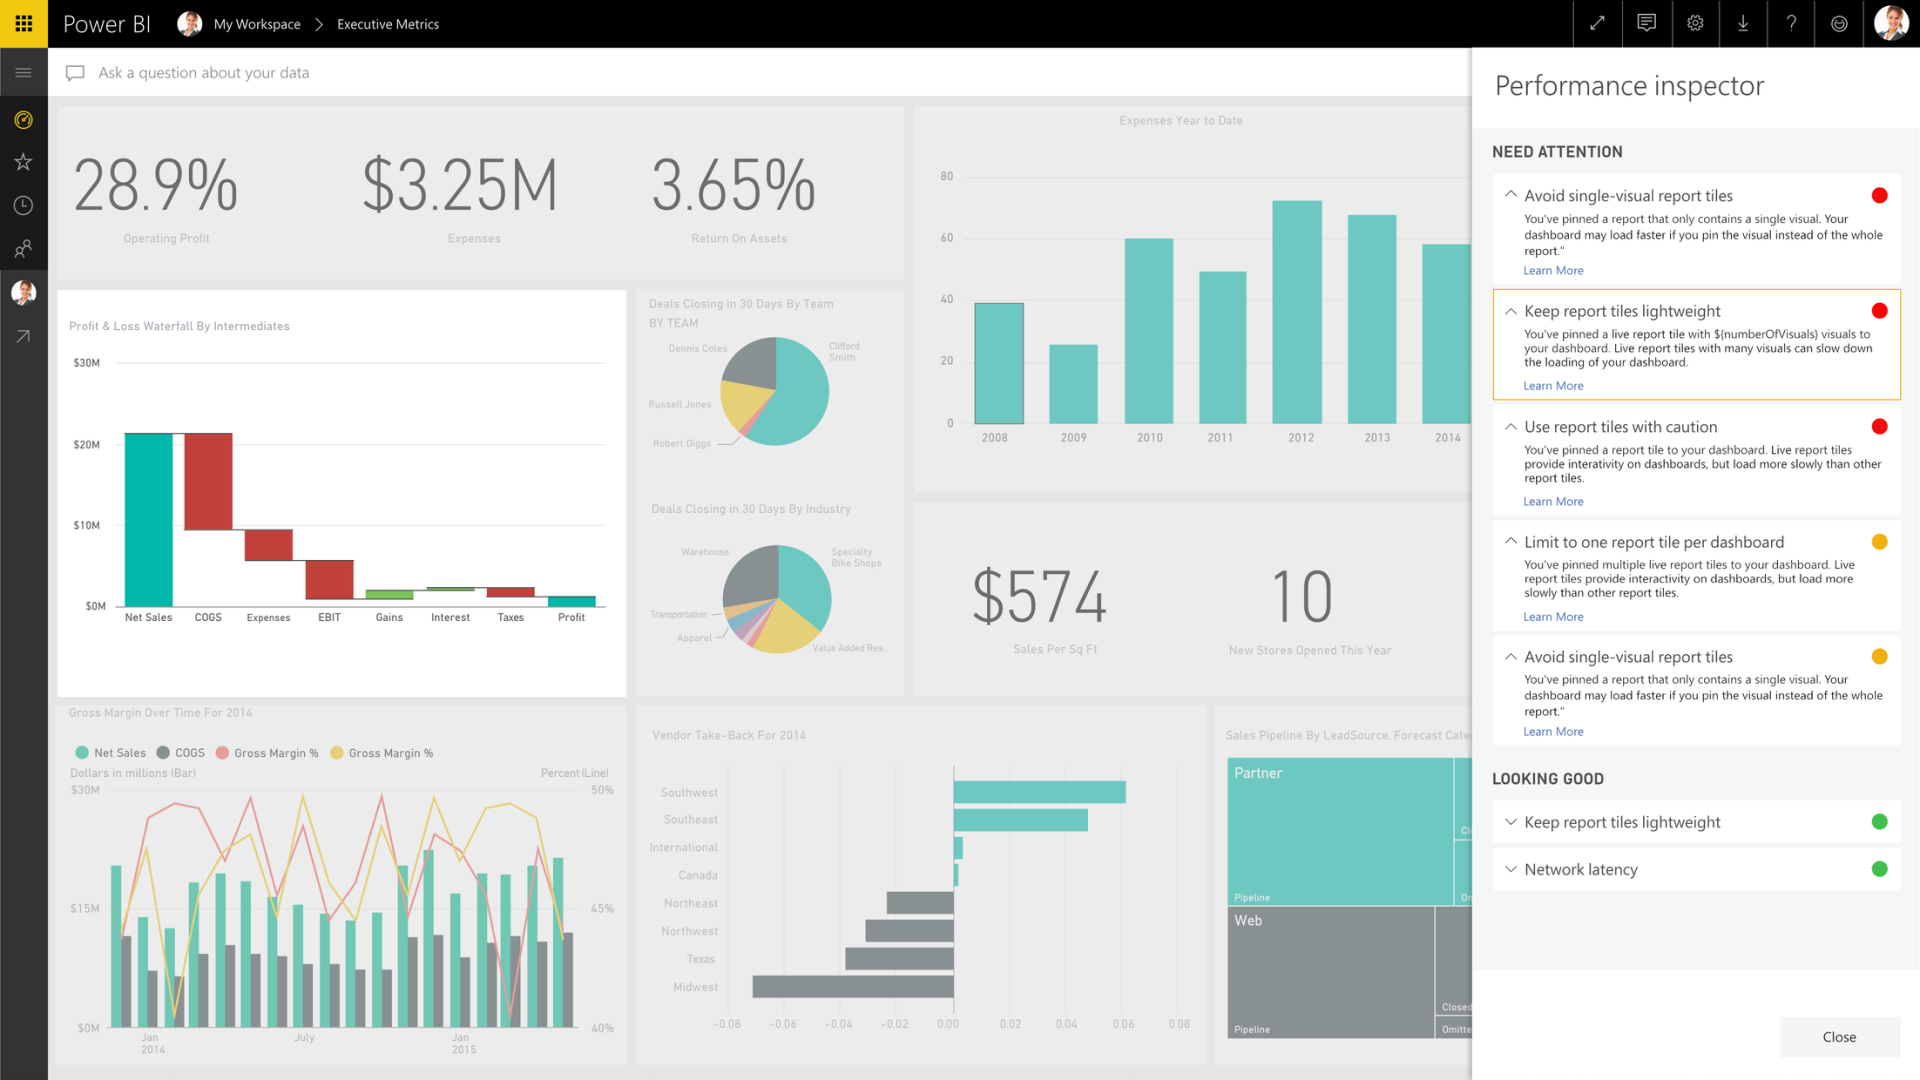
One of the critical factors in delivering a great overall experience in Power BI is performance. As creators, users want their dashboard to load fast and provide quick insights to their customers. To aid this process, we added a feature called Performance Inspector in the Power BI service that helps users inspect and diagnose why the loading time is poor. They’ll see alerts that identify the potential issue and suggest a fix.